Public school spending and student achievement in Kansas resemble an escalator; one side (spending) goes up, and the other (achievement) goes down. That’s the analysis of a study from the Kansas Policy Institute, the parent company of the Sentinel.
As a result, the Sunflower State has one of the lowest “productivity rankings”, a measure of test scores per dollar spent per pupil, in the nation. In other words, Kansans are seeing relatively low “bang for their education buck.”
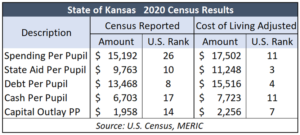
As this table illustrates, the state had the 11th-highest spending per pupil at $17,502, over 8% above the national average of $16,171, according to the most recent spending statistics available from 2020. Its state aid ranks #3 in the United States at $11,248 per pupil. Both numbers for Kansas and all other states are adjusted for cost-of-living differences using the Missouri Economic Research and Information Center because a dollar spent in Kansas buys a lot more than in most states.
Kansas was #13 in per-student spending and #6 in state aid based on 2019 spending data from U.S. Census.
However, the large expenditure increase over the last few years has not translated to improved test scores, as school districts said would happen when they sued taxpayers for a $1.1 billion increase. Instead, achievement continues to decline.
An analysis of state comparisons offered by the National Assessment of Educational Progress (NAEP) for 2022 shows Kansas again lagging behind the national average and lower than in 2019. Its composite score of 243 for the eight primary measurements (reading and math for 4th and 8th graders, including low-income students and all other students) is ranked #36.
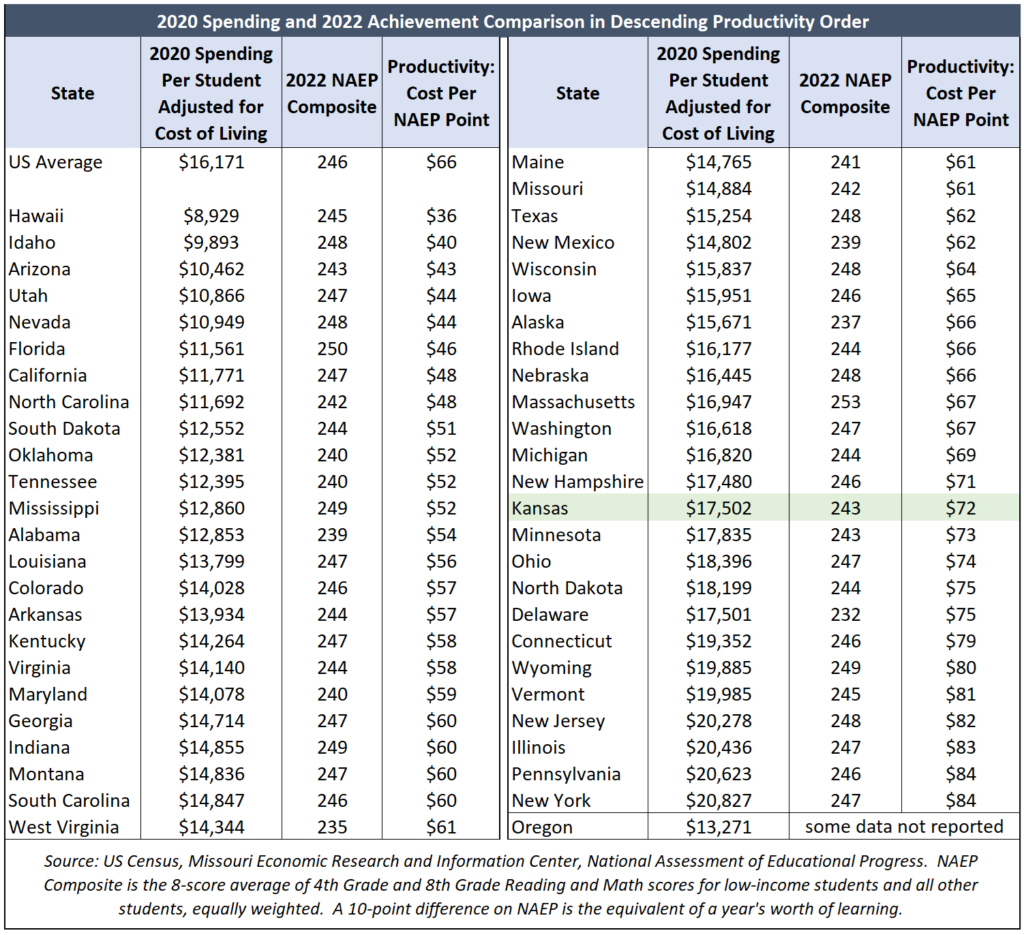
This table reflects each state’s productivity ranking, found by dividing the per-pupil spending by its NAEP composite score. Research shows Kansans paid $72 per NAEP point, whereas the national average is $66. Kansas is #38 on the ‘bang for the buck’ productivity list, down from #36 in 2019.
The analysis also refutes the notion that spending more money causes test scores to rise.
For example, 26 states have the same or better NAEP composite as Kansas but spend less per student.
Here’s another. Ten states have a 247 NAEP composite, but spending goes from a low of $10,866 per student in Utah to $20,827 in New York.
It’s likely that Kansas is now among the ten highest states for cost-of-living adjusted per-student spending, as spending jumped about 9% since 2020.